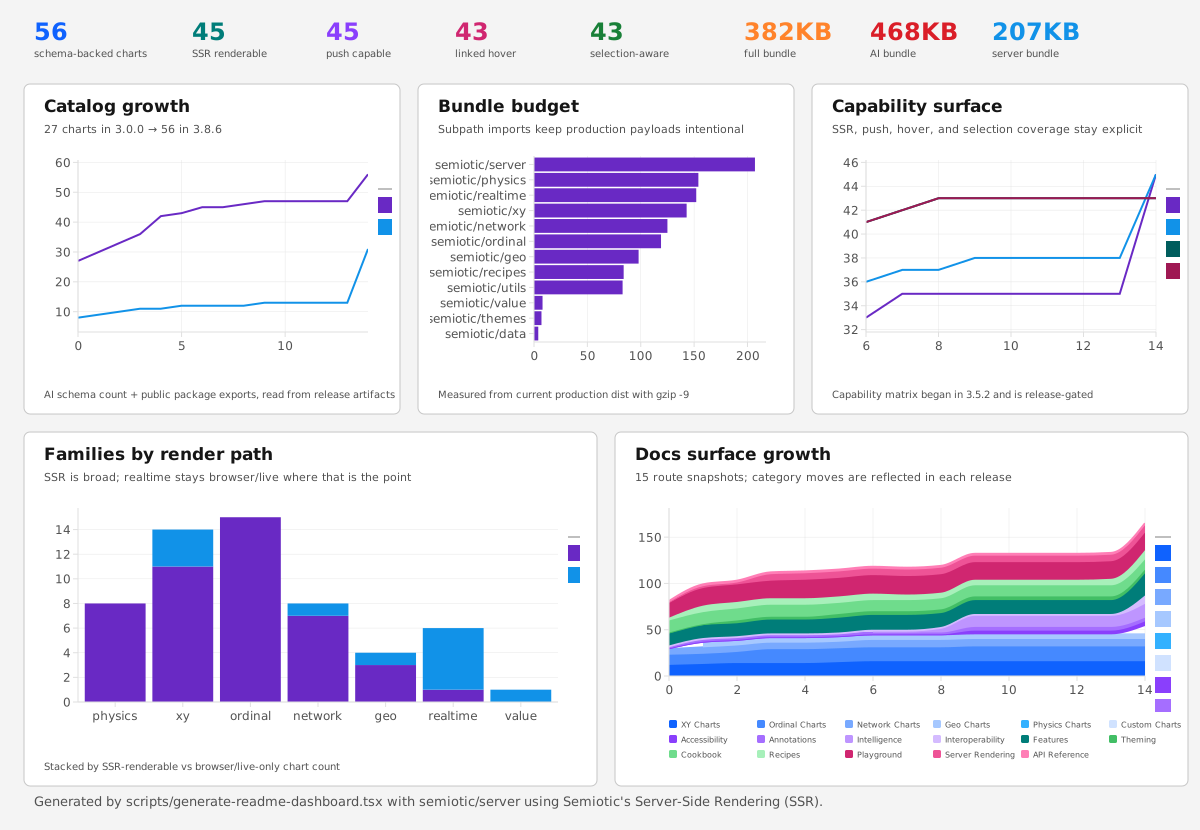
This release adds 1 notable feature for engineering teams evaluating rollout.
Published 1mo
MCP Data & Storage
✓ No known CVEs patched
✓ No known CVEs patched in this version
Topics
ai
d3
data-visualization
nteract
react
streaming
+1 more
visualization
Summary
AI summaryFixed ForceDirectedGraph edge width to honor the weight field.
Full changelog
Fixed
- ForceDirectedGraph edge width now honors a weight field. A string
edgeWidth
accessor (e.g.edgeWidth="weight") read the property off theRealtimeEdge
wrapper instead of the underlying edge data, so every edge silently fell back to
width 1. Field and functionedgeWidthaccessors now resolve against the raw edge
(mirroring node styling), and thesemiotic/serverrenderChartpath gained the
sameedgeWidth/edgeColor/edgeOpacityhandling for SSR parity. - Crowded bar-chart category labels no longer overlap. Ordinal category axes
(BarChart and siblings) now thin their tick labels to an evenly-spaced subset when
too many bins crowd the axis — the classic temporal-histogram case. Charts with few
enough categories to fit are unchanged. - Custom-layout overlays no longer drift on the first responsive resize. XY custom
layouts (XYCustomChart, GoFish recipes) skipped the layout re-run on a
dimension-only change and tookcomputeScene's fast coordinate-remap path, which
rescales canvas scene nodes but never regenerates the SVG overlays — so glyph chrome
(e.g. the GoFish flower petals) stayed at the pre-measurement width and sat offset
from their scene nodes until any other change forced a rebuild. Custom layouts now
always re-run on a size change, keeping overlays and scene nodes aligned.
Changed
- BarChart suggestion caveat for temporal categories. When a BarChart's category
axis holds time-bin labels (month/weekday names,YYYY-MM,Q3,Week 12, or a
temporal field name),suggestChartsnow surfaces a caveat pointing toward a
time-aware treatment (real dates + LineChart/AreaChart, or a temporal histogram for
streaming counts).
Weekly OSS security release digest.
The CVE patches and breaking changes that affected production tools this week. One email, every Sunday.
No spam, unsubscribe anytime.
Share this release
About nteract/semiotic
React data visualization MCP server with 30+ chart types. 5 tools: suggest charts for a dataset, render validated React configs to SVG, diagnose configuration anti-patterns, get component schemas, and report issues.
Related context
Related tools
Earlier breaking changes
- v3.8.1 Removed `/healthz` alias; only `GET /health` is supported for health checks.
- v3.8.0 Deprecates `GuantletChart` typo alias; use `GauntletChart`. Migration required.
- v3.6.0 Changes DifferenceChart to accept 2+ series via top‑2 subselection, adding caveats for extra series.
- v3.6.0 Changes AreaChart to a single‑series chart; multi‑series inputs are subselected.
Beta — feedback welcome: [email protected]