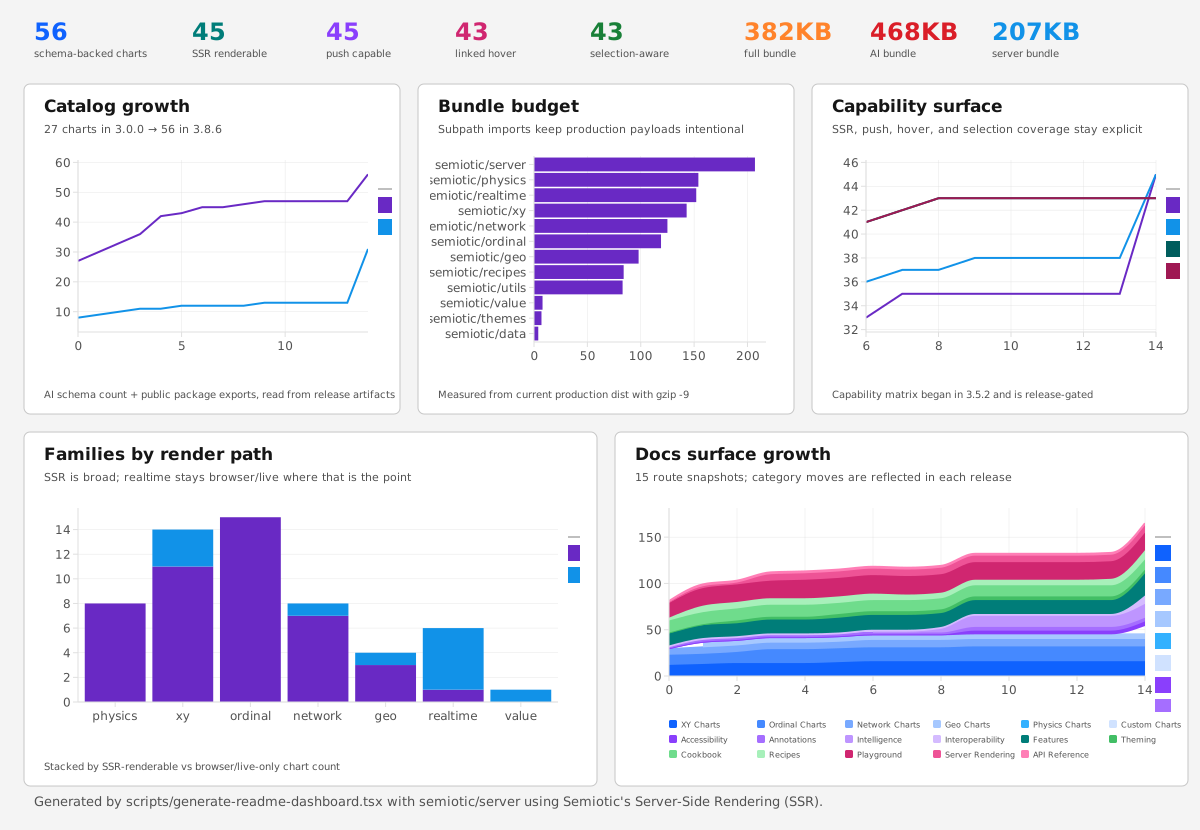
This release adds 2 notable features for engineering teams evaluating rollout.
✓ No known CVEs patched in this version
Topics
+1 more
Summary
AI summaryBrowser, static SVG, and MCP rendering paths are aligned on chart-mode defaults, styling, legend layout, histogram configuration, and specialized renderers.
Full changelog
Added
- Narrative examples. Added Earthquakes and Europa Languages examples,
including deterministic data fixtures and example-gallery previews.
Changed
- Browser/server rendering alignment. Browser, static SVG, and MCP render
paths now share chart-mode defaults, line and geo styling, legend layout,
temporal histogram configuration, and specialized network, geo, gauge, and
custom-chart rendering behavior. - SSR parity coverage. Replaced the redundant SSR/CSR screenshot matrix
with semantic markup and targeted geometry assertions, while retaining the
dedicated cross-browser visual suite.
Fixed
- Docs example route smoke test. The route contract now targets the
ExamplePageLayouttitle specifically, and the Earthquakes dashboard uses a
nested heading level instead of duplicating the page's H1.
Weekly OSS security release digest.
The CVE patches and breaking changes that affected production tools this week. One email, every Sunday.
No spam, unsubscribe anytime.
Share this release
About nteract/semiotic
React data visualization MCP server with 30+ chart types. 5 tools: suggest charts for a dataset, render validated React configs to SVG, diagnose configuration anti-patterns, get component schemas, and report issues.
Related context
Related tools
Earlier breaking changes
- v3.8.1 Removed `/healthz` alias; only `GET /health` is supported for health checks.
- v3.8.0 Deprecates `GuantletChart` typo alias; use `GauntletChart`. Migration required.
- v3.6.0 Changes DifferenceChart to accept 2+ series via top‑2 subselection, adding caveats for extra series.
- v3.6.0 Changes AreaChart to a single‑series chart; multi‑series inputs are subselected.
Beta — feedback welcome: [email protected]