Tools
Observability tools 66 tools
66 tools

Valkey-first observability with Redis compatibility. Query real-time metrics, analyze slow commands, detect hot keys, and investigate performance issues directly from AI coding assistants.

Complete open-source monitoring and observability platform.

AI Observability & Evaluation

🪢 Open source LLM engineering platform: LLM Observability, metrics, evals, prompt management, playground, datasets. Integrates with OpenTelemetry, Langchain, OpenAI SDK, LiteLLM, and more. YC W23
Debug, evaluate, and monitor your LLM applications, RAG systems, and agentic workflows with comprehensive tracing, automated evaluations, and production-ready dashboards.
The open-source notification infrastructure. In-app Inbox component, E-mail, SMS, Push and Slack Integrations.
The Cloud Native Webhooks Gateway
Real-time monitoring for Proxmox, Docker, and Kubernetes with AI-powered insights, smart alerts, and a beautiful unified dashboard

tropical_fish: Beats - Lightweight shippers for Elasticsearch & Logstash

VictoriaMetrics: fast, cost-effective monitoring solution and time series database
SigNoz is an open-source observability platform native to OpenTelemetry with logs, traces and metrics in a single application. An open-source alternative to DataDog, NewRelic, etc. . Open source Application Performance Monitoring (APM) & Observability tool

Monitor everything with a single container

The open and composable observability and data visualization platform. Visualize metrics, logs, and traces from multiple sources like Prometheus, Loki, Elasticsearch, InfluxDB, Postgres and many more.
Realtime log viewer for containers. Supports Docker, Swarm and K8s.

trollface: Self-hosted, lightweight server and website monitoring and O&M tool
Tianji: Insight into everything, Website Analytics + Uptime Monitor + Server Status. not only another GA alternatives

The core of our monitoring platform with a powerful configuration language and REST API.

Lightweight, single-binary log analytics interface for ClickHouse, focused on high-performance querying and visualization
Like Prometheus, but for logs.
A command line utility to work with Sentry.

Open-source reporting platform to build and share live dashboards from APIs, SQL and NoSQL databases, with powerful AI assistant, scheduling, and embeddable charts

Self-hosted Error Tracking
Parseable is an observability datalake built from first principles.

Developer-first error tracking and performance monitoring
OpenTelemetry Collector

Rybbit - open-source and privacy-friendly alternative to Google Analytics that is 10x more intuitive.

Agent for collecting, processing, aggregating, and writing metrics, logs, and other arbitrary data.

Argus is a lightweight monitor to notify of new software releases via Gotify/Slack/other messages and/or WebHooks.
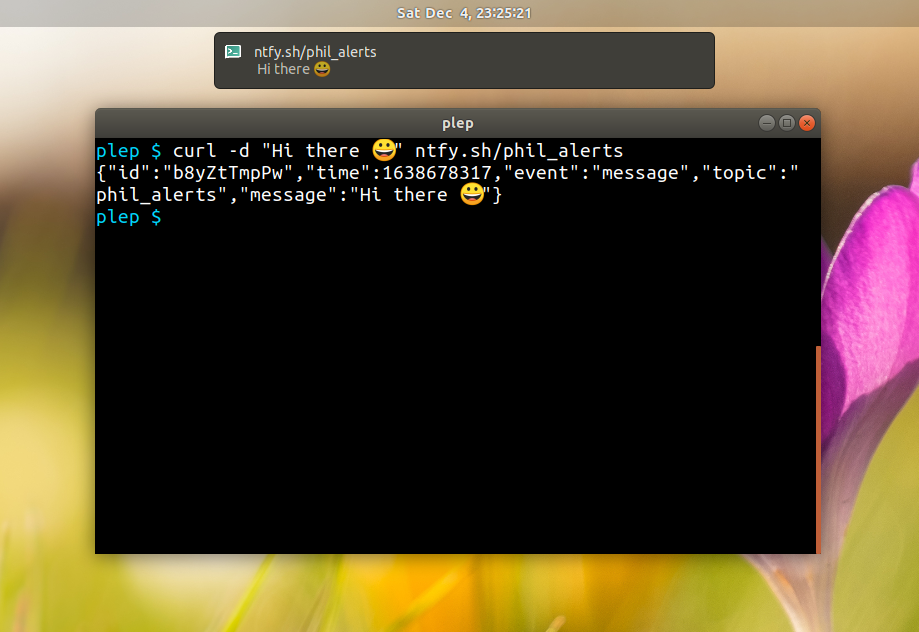
Send push notifications to your phone or desktop using PUT/POST
Cloud-native search engine for observability. An open-source alternative to Datadog, Elasticsearch, Loki, and Tempo.
Speedtest Tracker is a self-hosted application that monitors the performance and uptime of your internet connection.
Get Alerts from your Docker Container Logs

Evaluation and Tracking for LLM Experiments and AI Agents
The Prometheus monitoring system and time series database.
Self-hosted Speed Test for HTML5 and more. Easy setup, examples, configurable, mobile friendly. Supports PHP, Node, Multiple servers, and more

Community-based GPL-licensed network monitoring system

Analyzes resource usage and performance characteristics of running containers.

Checkmate is an open-source, self-hosted tool designed to track and monitor server hardware, uptime, response times, and incidents in real-time with beautiful visualizations. Don't be shy, join here: https://discord.com/invite/NAb6H3UTjK :)

Empowering People Ethically — Matomo is hiring! Join us → https://matomo.org/jobs Matomo is the leading open-source alternative to Google Analytics, giving you complete control and built-in privacy. Easily collect, visualise, and analyse data from websites & apps. Star us on GitHub ⭐ – Pull Requests welcome!
Best and simplest tool for website change detection, web page monitoring, and website change alerts. Perfect for tracking content changes, price drops, restock alerts, and website defacement monitoring—all for free or enjoy our SaaS plan!

Open Source network and infrastructure monitoring and management.

Kuvasz (pronounce as [ˈkuvɒs]) is an open-source uptime and SSL monitoring service, with multiple notification channels, status pages, IAC support via YAML, Prometheus integration, a complete REST API and many more!

The fastest path to AI-powered full stack observability, even for lean teams.

Swetrix is a cookie-less, open source, privacy-first web analytics, website speed monitoring and error tracking service that you can host yourself or use in the cloud. Get started for free!
Dynacat is a dashboard focused on dynamic reloading and easy integrity with external applications.
Stunning status pages, batteries included!
Realtime server for reliable two-way communication to power-up any backend
Apprise - Push Notifications that work with just about every platform!

Traccar GPS Tracking System
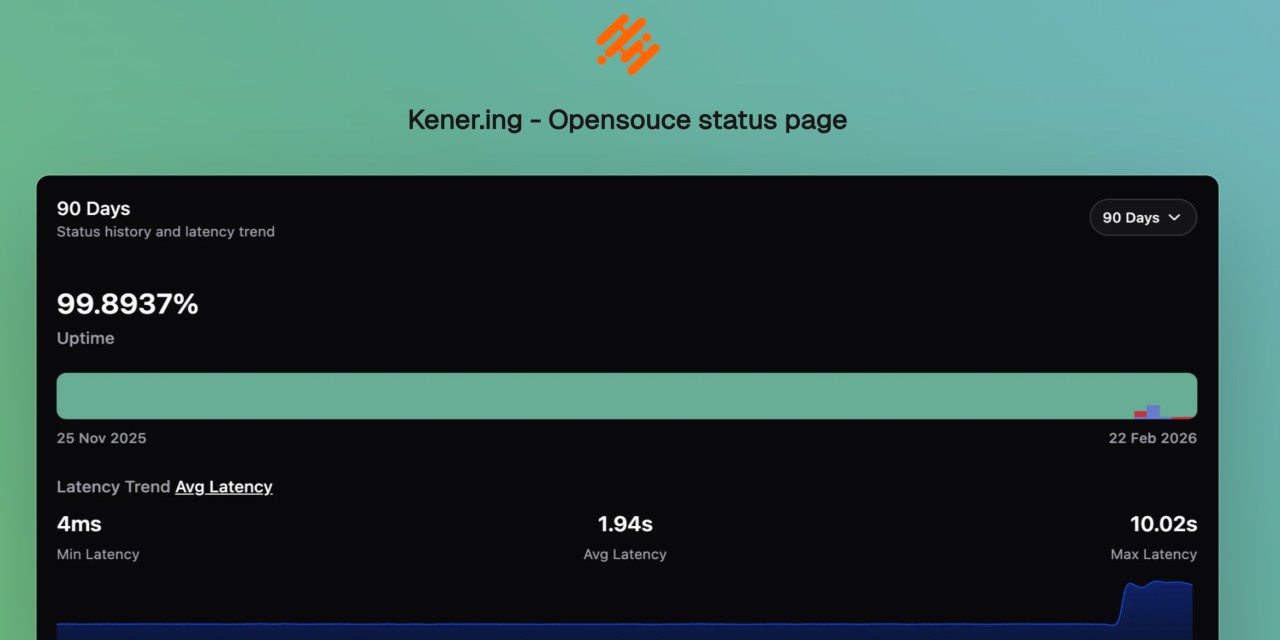
Automated developer-oriented status page with alerting and incident support